Echoview Benefits
-
Award winning and easy to use
Echoview makes your data processing faster, easier, more objective, and cost effective
-
Mature and trusted scientific software
With 25+ years of development experience
-
A global community of users
Customers in over 60 countries
-
Industry standard
Referenced in 2,000+ scientific publications
-
Data analysis
Compatible with 75+ echosounder and sonar file formats from 17 manufacturers
-
Expert team
Helpful and rapid support from experienced scientists
- Analysis Suite
For those needing the full power of Echoview and its extensive tools for exploring, processing, and analyzing hydroacoustic data. Includes the Essentials module.
-
Survey Suite
Designed to support the collection, visualization and cataloging of echosounder and sonar data, whether in the field or in the office.
-
Habitat Classification
Characterize and classify the nature of submerged vegetation and the bottom from echosounder backscatter measurements.
Suites
Analysis Suite
Modules can be added to increase your processing capabilities
Essentials
Read and display echograms from supported echosounder and sonar data files. Detect the bottom and surface, and define other reference lines. Create 3D digital terrain models of the seabed and 3D displays of map data. Calculate calibration corrections, perform quality control, conduct analyses on data, and export results for use elsewhere.
Automation
Automate data processing using a language of your choice (COM interface supplied).
Advanced Operators
Manipulate your data by creating new echograms from existing ones using advanced operators and algorithms. Compare frequencies, mitigate noise and other unwanted backscatter, classify data, interpret, and apply Python source files, and more.
Fish Tracking
Detect and analyze the tracks of individual fish and other targets in single and split beam data. Count fish and examine their behavior over time.
School Detection
Detect and analyze fish schools or bubble aggregations in single- and split-beam data.
Multibeam Fish Tracking
Detect, track, and analyze individual fish targets in data from multibeam systems, including imaging sonars. Fish tracking in data from single- and split-beam systems is included.
Multibeam School Detection
Detect, track, and analyze fish schools or bubble aggregations in data from multibeam systems.
Survey Suite
Stand-alone or in combination with the Analysis Suite.
Survey suite
Read data and display echograms from supported systems. Save echograms as image files. Annotate echograms using regions, and export annotation logs. Display and explore echograms, cruise tracks and 3D curtains from existing supported data files, or in real-time from selected Simrad, BioSonics, Sound Metrics and Kongsberg echosounders and sonars. Includes a license for Echoexplore, a tool to catalog and view hydroacoustic data files.
Habitat Classification
Stand-alone or in combination with the Analysis Suite.
Habitat Classification
Detect and analyze submerged aquatic vegetation in single- and split-beam data, then export results. Detect, analyze, and classify the bottom substrate in single- and split-beam data for seabed characterization and habitat mapping purposes, then view and export classification results.
Echoview 14: multibeam resampling, data combining, and other new operators

Echoview 14 brings four handy new operators, plus new features in several existing operators.
Join opposing pings
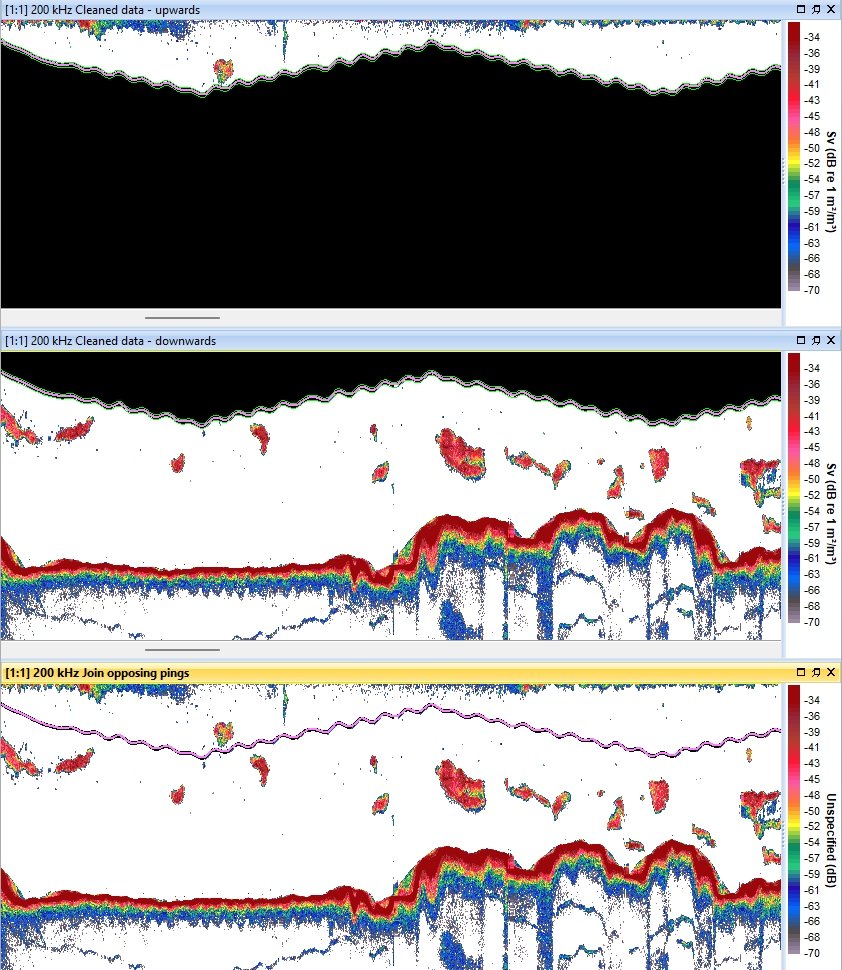
This operator gives you the ability to join and visualize single beam data collected from platforms where co-located transducers are pointing in opposite directions, such as a glider with transducers facing both upwards and downwards.
The following echograms (kindly shared by Chad Waluk and Kelly Benoit-Bird at Monterey Bay Aquarium Research Institute, USA) show data collected using an EK80 Mini from an autonomous underwater vehicle (AUV). Two pairs of multiplexed Simrad transducers were attached to a passively-moving gimbal that maintained their orientation, with one set of transducers looking upward and one downward as the vehicle undulated through the water. The top panel is the upwards data, middle is the downwards data, and the bottom panel is the resulting echogram created using the Join opposing pings operator.

Ping time difference
The Ping time difference operator replaces samples in every ping with a number that represents the time elapsed (seconds) between the current and the previous ping, making it easy to explore your data and visualize its collection characteristics, and to filter data based on time using downstream operators like Data range bitmap.
For more info write me
Email : gosoftvip@163.com
telegram : @sacyou888
